Matthew Kurtz | Contributor
Featured image: Increases in the wages of high-income administrators at York has only served to further the void between tax-payer and public servant, at the expense of the tax-payer.
As a former full-time academic, I teach classes occasionally at University of Ottawa, and it is a pleasure to do so. That being said, I am concerned about the sustainability of universities, because the total cost of administrators has been rising rapidly for years.
As public servants, administrators are demonstrably consuming ever-larger portions of university expenditures; York provides an unsettling example.
The issue is timely. In the near future, the Board of Governors at York will release a draft of their Executive Compensation Program. The document will set new limits on the compensation awarded to York’s president and vice-presidents. In compliance with new legislation, the board will then ask for comments in a public consultation before they seek approval from the provincial ministry.
Nine other universities have already completed this process across Ontario, including Queen’s and uOttawa. As I write, three more are now seeking public feedback: McMaster, Ryerson, and Trent. At stake are the raises that the public will allow for their top executives at York and, more importantly, the effect of those raises on the total cost of the institution’s high-income administrators. As students and taxpayers, how much are you willing to pay to support this growing class of remarkably well-paid university employees?
Let’s start with some numbers. In 2016, the president of York was paid a salary of $463,105. The salaries for the university’s four vice-presidents averaged to $308,147 that year.
These figures are large, so I’ll help put them in perspective. At REGI Consulting, in support of our work for various stakeholders in higher education, I built a database from Ontario’s sunshine lists. This database allows us to track yearly changes in income for 6,496 distinct university managers around Ontario from 1996 to 2016, including 608 administrators at York.
With this database, we can easily make some comparisons. Many policy leaders would want to compare these compensation levels between universities. Others are interested in internal points of reference. For instance, how much more does the president make than a dean at the same university?
While such comparisons are useful, they miss a third—and arguably most important—avenue of comparison: compensation of our top public servants relative to the income of a typical taxpayer.
For that reason, we incorporated data about the annual median individual income in Ontario, which was $33,200 in 2015. This means half of Ontario’s individual taxpayers made less that year, and half made more. In Figure 1, the red line shows the change in the median income over twenty years. It reflects the fact that Ontario’s working people and middle class have made little headway.
Nonetheless, taxes paid by middle income earners help fund the operating grants that provide a major source of revenue for York and other universities around the province. Thus, it makes sense to compare the executive salaries to a clear measure of progress among such taxpayers. If you know that the top five public servants at York had an income of $340,624 in 2015 on average, then a quick calculation shows they made 10.3 times as much as Ontario’s typical taxpayer.
This is a ratio that we can track over time. For York’s top five executives, the ratio was 7.4 in 1996. It increased rapidly over 14 years to 11.1 in 2010, when the province first imposed a wage-freeze on its top executives. By 2015, the ratio had dropped to 10.3. Figure 1 gives a sense of these changing ratios in terms of real dollars. It shows the average income for York’s top five executives (with the black line) relative to the median income far below (in red).

We can also compare York’s executive compensation to the average for the five best-paid executives at each of Ontario’s six U15 schools. The U15 is a small group of research-intensive universities in Canada. It includes U of T, McMaster, Ottawa, Queen’s, Waterloo, and Western. They are not the best equivalents, but to see where York’s executive salaries stand in comparison, they might do.
The results, shown in Figure 1, reveal that top-level compensation at York tracked the average for Ontario’s six U15 schools rather closely. On average, their executives had made 7.9 times as much as the typical taxpayer in 1996. This climbed to a peak of 11.1 before dropping to 9.8 by 2015.
The important point from the data in blue is that there was a widespread break in the upward trends. This break occurred around the Great Recession of 2008. The salaries of Ontario’s university executives climbed rapidly from 2001 and 2008. After that—broadly speaking—their compensation remained fairly constant, in part due to a wage freeze imposed on Ontario’s university executives.
We can use this break to track the raises among all high-income university administrators, including the executives. For this, we divided York’s administrators into four income groups: $130,001 to $150,000; $150,001 to $200,000; $200,001 to $300,000; and over $300,000. Each bracket was adjusted for inflation. In 2002 for example, university employees near the $130,000 lower boundary would have actually earned something a little over $101,250 before adjusting upward for its 2016 equivalent.
Across all years, the lower boundary of $130,000 (in 2016 dollars) was roughly four times the income of Ontario’s typical taxpayer. Because of that simple ratio—four times the median income—we defined anyone who made over this amount as a “high-income administrator.”
To calculate the average raises from the information in our database, certain cases were automatically removed. The removals included any administrator in their second year on the job (their first year likely reflected a partial salary), anyone in their final year on the job, anyone who switched institutions, and anyone who had changed jobs. The averages were based on over 700 individual raises, continuations, and clawbacks issued to a smaller number of administrators at York over 14 years. The results are shown in Table 1.

What do these results reveal? In the seven years up to 2008, the executives and several deans at York saw their salaries increase by leaps and bounds—almost 10 per cent annually, on average. Afterwards, their income growth slowed considerably, constrained in large part by legislation.
And yet after 2008, other administrators (those who made between $130,000 and $200,000 annually) continued to see raises averaging around four per cent. They were doing the same job, but during these contentious years of campus austerity, the top executives at York chose to award these administrators—who were already making four to six times the income of a typical taxpayer—with significant raises.
All nine universities who have completed their public consultation call attention to the latter sorts of raises. They call the issue “salary compression.” This means the salaries of subordinate administrators were catching up to the wages of top-level (or “designated”) executives.
The language of UOIT noted on page 8 was not unusual: “The salaries of non-designated management employees have been increasing year over year, at an average annual rate of 3.3 per cent,” so significant raises for the top executives are “needed to mitigate the salary compression that has resulted” since the wage freeze.
Here, we can begin to see an important reason why the costs of university education are increasing at York and across the province. Salaries for the top five executives have largely been stable since 2009, but we are paying more and more to the upper-level administrators below them. As a result, the general salaries of high-income administrators are climbing appreciably at York.
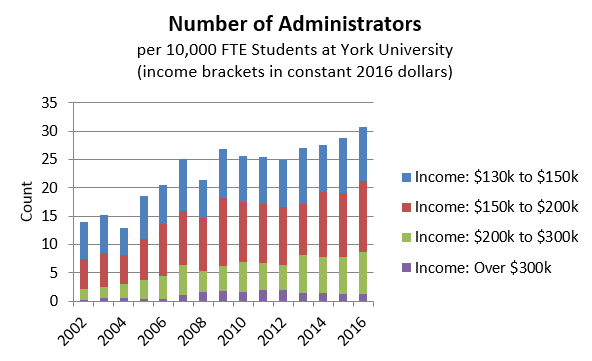
What about the number of university managers who earn such salaries? It turns out, that figure has increased even faster. In 2002, York employed eight administrators with incomes over the equivalent of $200,000. By 2016, there were 40. In more complex terms, the university had 13.9 high-income administrators for every 10,000 full-time equivalent students in 2002. By 2016, there were 30.7 such employees per 10,000 students—over twice the density.

As Figure 2 shows, the most explosive growth at York occurred between 2004 and 2009. But since 2012, the administrator count in the $150,000 to $300,000 range has increased rapidly as well.
In short, our analysis shows two trends. First, the number of well-paid administrators at York climbed much faster than enrollment. Second, salaries increased quickly for a large swath of university managers. The latter has contributed to higher levels of income inequality in the Toronto region, but the two together have added substantially to the cost of a university education at York.
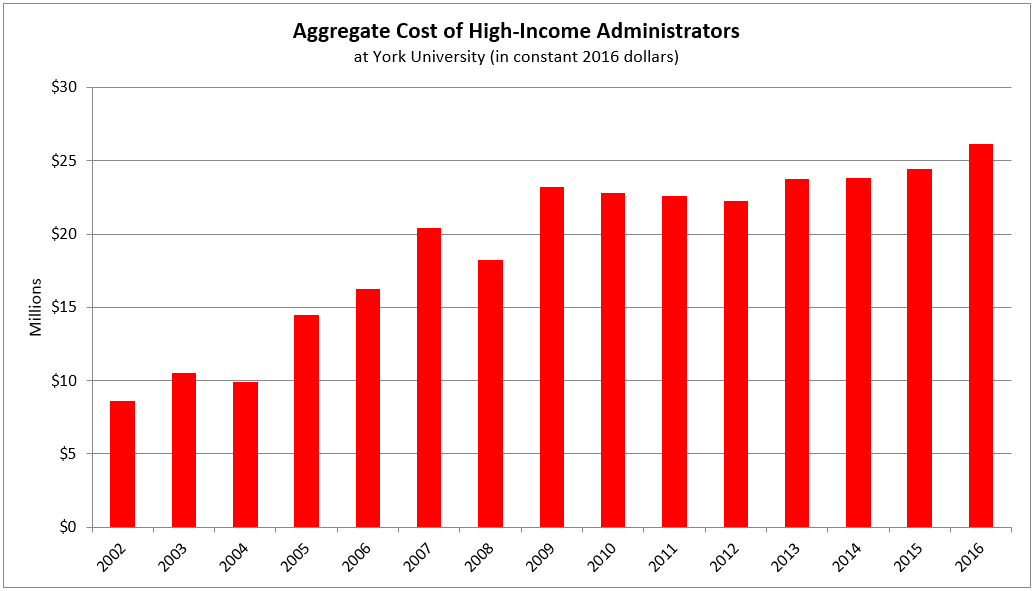
Figure 3 shows the rising cost of high-income administrators at York. We have seen the total cost of their employment increase from $8.6 million in 2002, to $26.2 million by 2016. Most of that growth was attributable to university managers with incomes over $150,000 (in constant 2016 dollars), or those making roughly four and a half times the median income in Ontario. Again, the lion’s share of that growth occurred between 2002 and 2009, before the executive wage freeze.

What does this mean in terms of the university’s finances? York has grown too over those same 15 years, but not by the same proportion. In terms of the universities’ total salary expenditures, the annual wages of high-income administrators accounted for 2.2 per cent of that line-item in York’s books in 2002. By 2015, those wages accounted for 4.3 per cent of York’s aggregate salary expenditures, and that percentage had risen from 4.0 over the three previous years.
As public servants, high-income administrators are consuming ever larger portions of the institution’s total expenditures. At York, one dollar out of every $25 spent in wages now lands in the pockets of high-income administrators. Most of that money could instead be going toward a tuition freeze, scholarships, building maintenance, better raises for front-line workers, research, or community partnerships.
Yet the problem is actually two-fold. When the university’s upper-level managers receive even larger portions of the revenue that people generate for the campus community as students, instructors, researchers, and taxpayers, we have a problem with the sustainability of the institution. When public servants make increasingly large salaries—four, seven, and even 11 times as much as the typical taxpayer—there is also a problem with rising disparities in income around Toronto.
The Board of Governors at York will have a chance to address both of these issues. They will propose specific limits to the compensation that you pay your president and vice-presidents. If they choose to, the Board can do so with an eye toward continuing to decrease the levels of disparity between their top executives and the median income in Ontario.
The Board will also identify the maximum rate of increase for the line-item (or “pay envelope”) from which your executives get paid. Unless the university community intervenes en masse, this rate is likely to be close to five per cent. That is because, to date, every other Ontario university board has proposed five per cent as the maximum increase allowed annually for additional executive compensation costs, with only one exception: Ryerson’s Board, which just proposed a 4.5 per cent maximum rate of increase.
But anything even close to a five per cent raise is far too much. When York leaders receive substantial raises from the board, it increases the chances that future executives will give larger raises to their close subordinates, and feel entitled to hire more managers who report to them. Table 1 and Figure 3 show what can happen when executives see significant rates of increase in their compensation.
When your Board of Governors releases a draft of their Executive Compensation Program, you will have a chance to provide feedback. There will be a 30-day window for comments. As members of the York community, you can help them create better executive compensation policies, those which are both socially responsible and more affordable. Please consider encouraging them to do so.


